Load Testing with Fiddler and StresStimulus
Introduction
As web applications grow in complexity, obtaining a good ‘baseline’ around their load handling capabilities becomes important. Obtaining a baseline is usually a pre-requisite to isolating any performance bottlenecks. Load Testing is a discipline that attempts to do just that (establish a consistent baseline). As with most disciplines, it has its own terminology and its own set of ‘popular’ tools. This article will get you started with the basics of load testing.The article centers around Fiddler – and a Fiddler extension called StresStimulus –which works alongside Fiddler and provides load testing capabilities.
Steps in Configuring a load test using Fiddler and Stresstimulus
There are 5 main steps in a typical load test. These consist of:
1. Capturing a Test Scenario
2. Configuring a Load Test
3. (Optionally) Configuring Performance Monitoring (performance counters)
4. Running a Load Test
5. Analyzing Results
Capturing a Test scenario
A scenario is the set of services that you would like to be part of your test. Think of it as a specific ‘use case’. As an example, say your user has to first login (goes through the login service), then perform a search – and possibly update an item from the list that was retrieved. Hitting these three services in sequential order – with an appropriate ‘think time’ between them, would be equivalent to simulating an actual ‘use case’. This could constitute ONE scenario. In Fiddler, these three service URLs would constitute three sessions.
StresStimulus would use these sessions as a starting point – and build a test scenario from these fiddler sessions.
Creating a Test Case with a Fiddler session
Once you have a Fiddler session active, you can use StresStimulus to create a new test case (scenario) from that session (as shown in the screenshot below). For example, a sample URL such as
http://mywebsite.com/user/login
would constitute a single session. A test case can be built from this single session as shown in the screenshot below. Use the Folder icon with the tooltip
Create a Test Case with the sessions in the grid on the left.
Configuring a Load Test
Once you have the Fiddler sessions and have created your test case as described above, you are ready to configure your load test. The load pattern and test duration are the two most important configurations in StresStimulus.
Set Type of Load(Load Pattern)
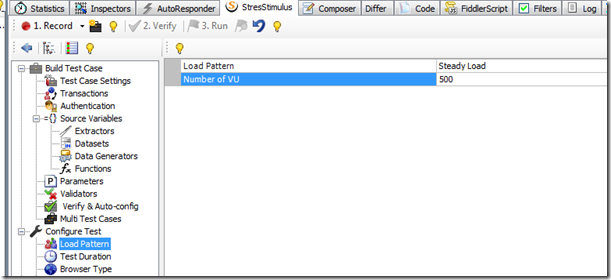
STEP load versus CONSTANT load. Typically, a web application does not start up handling its maximum load. Rather, the load builds up gradually. A STEP load helps capture this dynamic. In contrast, you could set your load test to a STEADY (CONSTANT) load of, say 500 Virtual Users. This is useful for bursty applications – where the traffic is known to peak at certain times – and stay less active at others.
Set Number of Virtual Users (also part of Load Pattern)
A virtual user (VU) represents an actual user on your website. A good load test would need to decide upfront the number of simultaneous users (load) that your website needs to handle. Most load testing tools are limited in the number of VUs they can generate. This may not be a problem. One can combine the maximum number of VUs with a ‘number of iterations’ to simulate a greater load. Usually, enterprise editions of load testing tools can generate unlimited VUs.
Set Test Duration
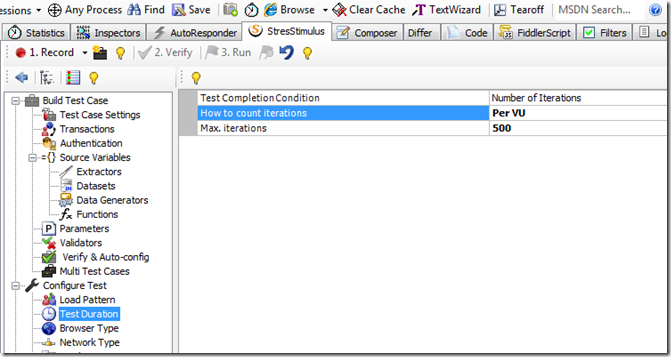
How to Count Iterations is to be set as PER VU. Each VU, by default runs one iteration of the configured scenario (use case). This goes on till the max VUs is reached (say 500).
Once you have reached 500 VUs (sent out 500 requests), your test continues to run until all responses are received (or timed out). The default timeout is set to 300 seconds – responses that take more than 300 seconds are marked ‘timed out’ and do not count towards the average response time.
Other basic configurations for your load test
Set Browser Type
Each browser type has a maximum ‘http connection’ limit – which affects the outcome of the load test. It is best to know the dominant type of browser used on your website (several analytic services – such as google analytics can provide this information). The default browser type is IE 9.
Set Network Type
Do your users tend to be home (cable modem) users? Or do they tend to be office (LAN) users? Or a mix of the two? All of these can be configured to provide a meaningful bandwidth during the load test.
Configure Performance Monitoring (see appendix A for a full list of ASP.NET,IIS,WCF specific counters)
Using the Configure Monitoring item (under Configure Test) in StresStimulus, one can add performance counters from the server being tested (if your server is on a remote box, you may need special access to enable remote performance monitoring).
Running Tests
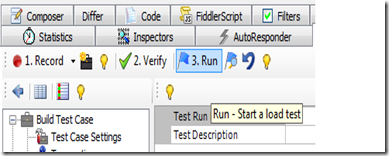
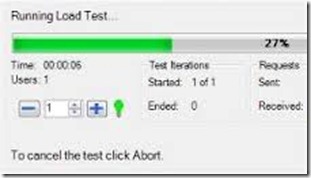
Once you have your test configured, you can Verify before running the test. The verification will ensure that you do not have any unwanted URLs in your sessions. Next, you can actually Run the tests by clicking Run. Each VU will execute the configured sessions – and you should see a progress bar as shown below.
 |
 |
Analyzing Results
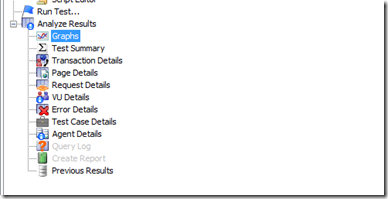
Once the tests have completed (either max VUs reached or Number of iterations reached), the tool creates a rich offering of results. Graphical results (including perf mon graphs) from your tests, summary (aggregate) of response times and fastest/slowest pages and more. Some of the more important metrics that most tools generate include:
 |
|
The two most important metrics to look at are Average Response Time and Average Requests per second (Throughput)
These are the two metrics you would need to see improving after your modifications. The two are self-explanatory – the response time is the total round trip time between the http request being made by the browser – and a response being received (http status OK or error). The requests-per-second is the number of successful responses that the server was able to return in a second (it managed to handle that many requests per second).
Advanced load testing features
Do you need to simulate multiple users each with their own set of credentials?
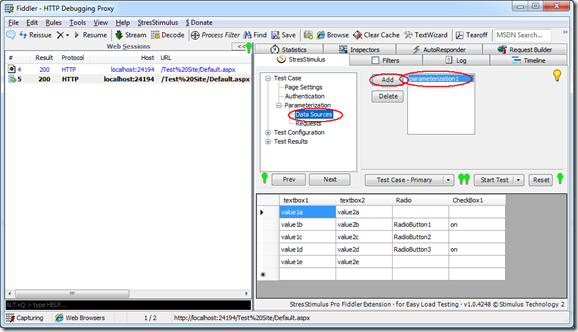
When a test needs to incorporate actual user data (e.g. different usernames, passwords for an LDAP load test), it is referred to as a ‘configured’ or ‘data driven’ test.
StresStimulus allows data from a CSV file (or other data source) to be used in a load test (see screenshot below).
During the load test, do you need to see each Fiddler request in the Fiddler window?
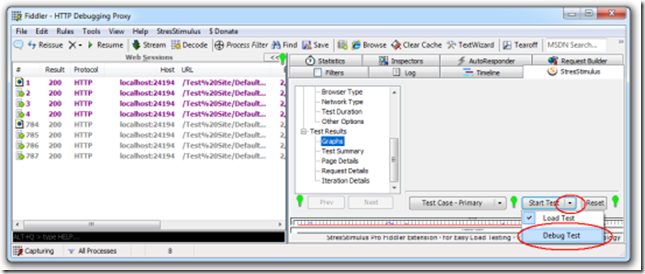
You can also see the requests generated by StresStimulus in the Fiddler window itself, but to do this, you have to run a debug test instead of a load test. After the previous test has finished, click the drop down button on theStart Test button and select Debug Test. Then click the button to start the test again:
Do you need to set a pause in between requests ? (Set Think Time)
Do you need to repeat the same load over different time periods (to average out bandwidth inconsistincies)? (Set Number of Iterations)
Each VU, by default runs one iteration of the configured scenario (use case). This goes on till the max VUs is reached (say 500). Once you have reached 500 VUs, you may choose to call your test complete. Or you may actually rerun the entire test again – a new iteration. This is useful because network bandwidth differs from hour to hour during the day. If you run a 1 hour iteration during your ‘lunch hour’, the results may not be the same as running the test during peak hours. A large number of iterations averages out the bandwidth inconsistencies.
Do you want to account for incomplete (timed out ) requests? Or ignore them altogether? (Set Completion Criteria)
You can designate your test ‘completed’ once it reaches MAXIMUM VUs. You may designate it complete once it completes the number of iterations (see above). Or you may simply set a time limit, say ‘1 hour’, at the end of which your test will automatically stop – and discard any incomplete requests (using only the completed requests for its results)
Do you need a higher/lower default timeout? (Configuring your own request timeout)
Summary
StresStimulus is a powerful Fiddler plugin that allows multiple requests to be simulated. It provides aggregate metrics such as average response time and average number of requests processed. In addition, it allows for real-time monitoring of performance counters during a load test.
Appendix A
– ASP.NET, IIS, WCF and SQL Server Specific Performance Counters during load testing
CPU Usage
- Processor Information\Processor Time
NET CLR (Memory and Threads)
- NET CLR Memory \ #bytes (in all Heaps)
Http Service Request Queues\CurrentQueueSize
IIS (Requests – current and queued)
- Requests Current and Requests Queued
- APP_POOL_WAS – for your specific application
ASP.NET (Requests – current, queued, rejected)
- In ASP.NET v4.0.30319\Requests Queued
WCF – Under Web Services
- Web Service\Current Connections – Maximum Connections
WCF – Under ServiceModelService
- Calls and Calls Outstanding. The calls outstanding correspond directly with the ‘requests pending’ counter in StresStimulus.These are the calls yet to be processed.
SQL Server
- Memory Page Faults / sec
- Under ‘Locks’—>Average Wait Time –> Greater than 5 secs
- Under ‘Locks’—>Deadlocks per second
Appendix B – Some other popular load testing tools
There are many more – but these are the some of the more widely used ones.
-
Fiddler – Free – and good for basic load testing (hold down SHFT key to execute multiple requests through fiddler). Several advanced features are available, if you are willing to write a little scripting code. Also get the book to make the most of this tool.
-
StresStimulus – A powerful plugin for fiddler, which lets you do most of what LoadRunner does – at a fraction of the cost. Cost – between $500 and $8000 depending on edition (mainly how many VUs you want to simulate) and monthly versus permanent licensing. NOTE that, to see the performance counters from a remote machine, you need the enterprise edition.
-
Visual Studio Ultimate – Web Performance Test Editor – A tool bundled into VS 2012 Ultimate – and powerful enough for basic load test performance metrics.
-
LoadRunner – The 800 lb. gorilla – which provides metrics at various levels. Also, costs upwards of $10,000 per CPU (correct me if things have changed).
-
Apache Bench (Ab.exe) – honorable mention – an apache tool that lets you do basic load testing. More info can be found in this post.

Leave a Reply