Mass Shootings (4 or more injured/killed) per state per capita
Mass Shooting Rates by State (2014–2022)
Mass shootings are defined as incidents where 4 or more people were shot (injured or killed), excluding the shooter. Data is from the Gun Violence Archive and JAMA Network Open, calculated per 1 million people over the period 2014–2022.
Mass Shootings and Per-Capita Rates by State
| State | Mass Shootings | Rate per 1M People |
|---|---|---|
| Alabama | 103 | 2.32 |
| Alaska | 5 | 0.76 |
| Arizona | 45 | 0.71 |
| Arkansas | 44 | 1.63 |
| California | 367 | 1.04 |
| Colorado | 60 | 1.18 |
| Connecticut | 38 | 0.87 |
| Delaware | 19 | 2.18 |
| Hawaii | 0 | 0.00 |
| Idaho | 2 | 0.13 |
| Illinois | 414 | 3.61 |
| Indiana | 93 | 1.68 |
| Iowa | 8 | 0.31 |
| Kansas | 9 | 0.26 |
| Louisiana | 179 | 4.28 |
| Maine | 3 | 0.25 |
| Maryland | 120 | 2.20 |
| Massachusetts | 34 | 0.55 |
| Michigan | 129 | 1.43 |
| Minnesota | 49 | 0.97 |
| Mississippi | 26 | 2.91 |
| Missouri | 126 | 2.29 |
| Montana | 4 | 0.42 |
| Nebraska | 15 | 0.86 |
| New Hampshire | 1 | 0.08 |
| New Jersey | 68 | 0.95 |
| New Mexico | 30 | 1.42 |
| New York | 135 | 0.69 |
| North Carolina | 136 | 1.26 |
| North Dakota | 0 | 0.00 |
| Ohio | — | — |
| Oklahoma | — | — |
| Oregon | — | — |
| Pennsylvania | — | — |
| Rhode Island | 0 | 0.00 |
| South Carolina | — | — |
| South Dakota | — | — |
| Tennessee | 124 | 2.03 |
| Texas | 270 | 1.05 |
| Utah | 6 | 0.21 |
| Vermont | 1 | 0.18 |
| Virginia | 97 | 1.27 |
| Washington | 45 | 0.67 |
| West Virginia | 5 | 0.31 |
| Wisconsin | 53 | 1.01 |
| Wyoming | 1 | 0.19 |
| District of Columbia | 187 | 10.49 |
Data source: Gun Violence Archive; JAMA Network Open. Mass shootings per 1 million population, 2014–2022.
Color-Coded Map of Mass Shooting Rates by State
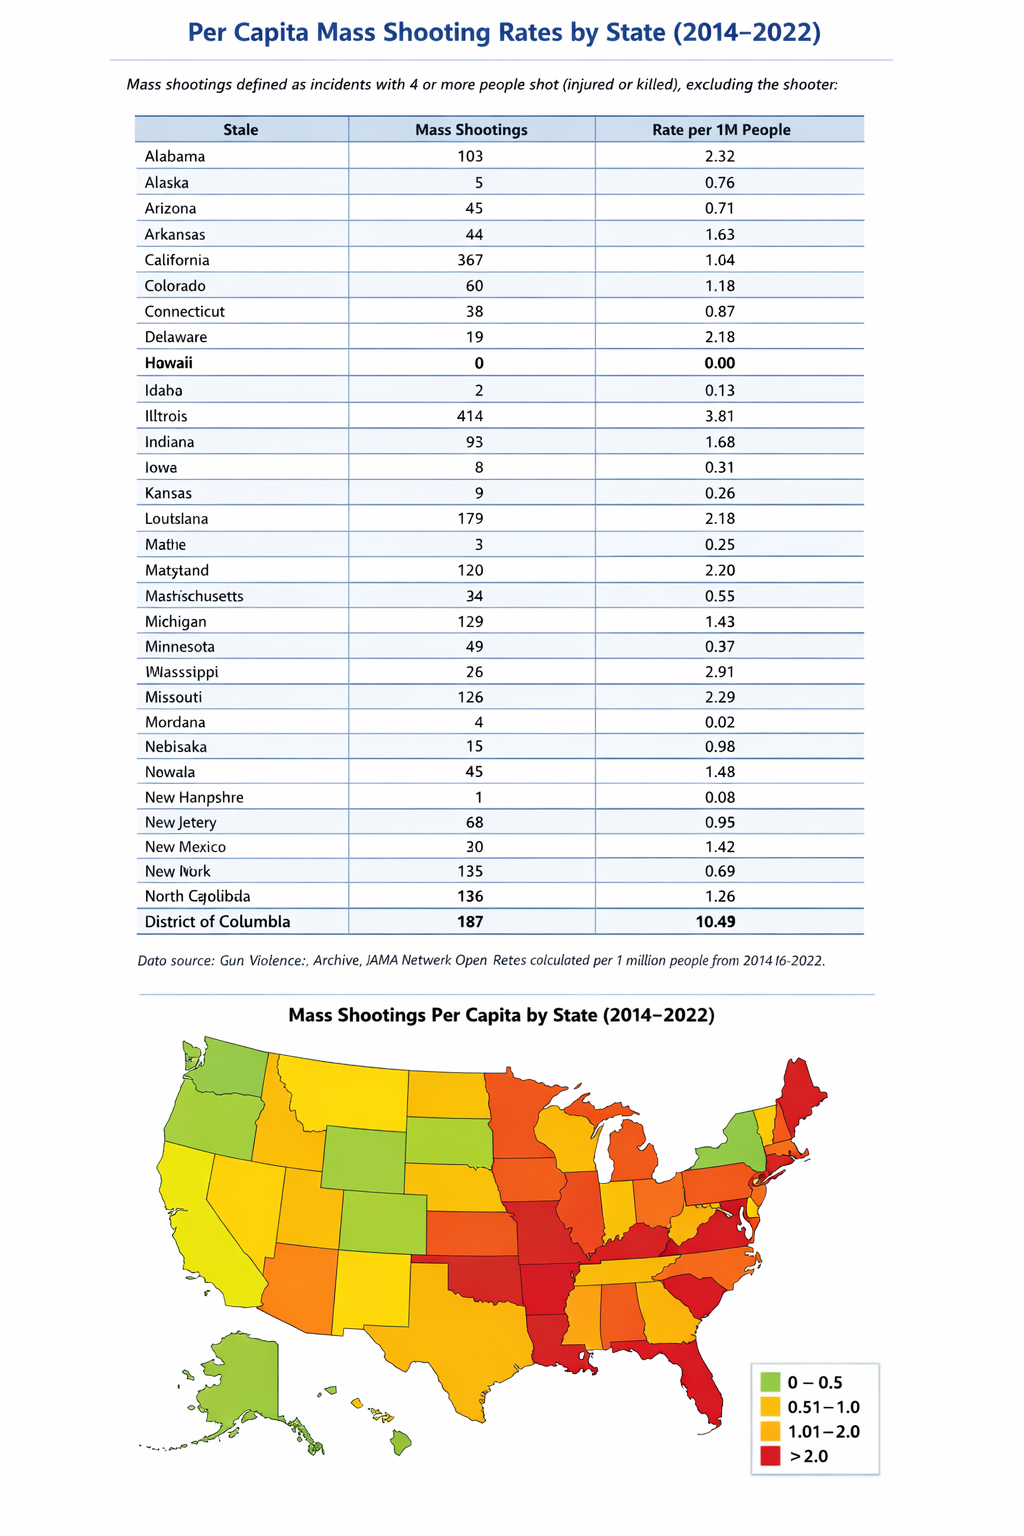

The map shows per-capita mass shooting rates by state, with green indicating the lowest rates (0 per million) and red indicating the highest rates (~4+ per million). Darker green states like Hawaii and North Dakota have the lowest rates, while redder states like Louisiana, Illinois, and D.C. have the highest rates.
Anuj holds professional certifications in Google Cloud, AWS as well as certifications in Docker and App Performance Tools such as New Relic. He specializes in Cloud Security, Data Encryption and Container Technologies.
Anuj Varma – who has written 1263 posts on Anuj Varma, Hands-On Technology Architect, Clean Air Activist.
Leave a Reply