A useful sql server (production) trace template
Introduction
To run a sql server profiler session, you need a ‘trace template’. The default built-in templates are a good starting point (especially the ‘tuning’ template). However, a more advanced version of the tuning template is provided here – something that you can run against high volume database instances – to uncover potential performance issues.
Using The Template
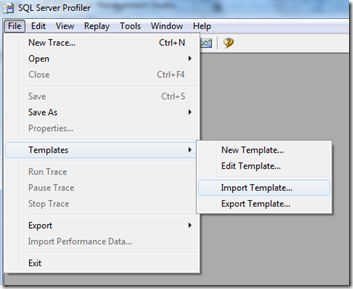
Simply import the template included below using the Templates—>Import Template from the Tools—> SQL Server Profiler menu
Now, try to run a ‘New Trace’ – and you should see your template (PerformanceTrace) in the drop down list of existing templates. In case you do not, you may need to manually copy the template (.tdf) file into the appropriate folder. I copied it into both of the folders below – for it to start showing up in the drop-down list of templates.
- C:\Program Files (x86)\Microsoft SQL Server\100\Tools\Profiler\Templates\Microsoft SQL Server\1050
- C:\Program Files (x86)\Microsoft SQL Server\100\Tools\Profiler\Templates\Microsoft SQL Server\100
Now, you should be able to select this ‘PerformanceTuning’ template in the drop down list.
Now you have the template – You are ready to create a trace
- Before you start tracing, you should have your load test ready to go – possibly your application (s ) stressing the database with a load of virtual users (see here to get started with load testing).
- Create a ‘New Trace’ using this template (it should prompt you for a filename to save the trace output). Do not start it yet. Uncheck the ‘roll over file’. Set max file size to 1GB (1000 MB).
- Start your load test
- Start your Trace. Let it run alongside your load test. It should output a trace file (or files if you specify rollover. I like to create one giant trace file – without the rollover).
What to do with the created trace output file? Database Tuning Wizard
The trace file you have just created is to serve as the input fro the database tuning wizard (also from the ‘Tools’ menu). This database tool (SQL Server Tuning Wizard) provides recommendations on improving the performance of your database. It will use the trace file you just created (select File and browse to your saved trc file).
IMPORTANT – The wizard does put a load on the target database – so you want to either run it after hours (check who all are logged on the instance by doing a sp_who command) – OR you can actually run it against a copy of the database. For example, most environments have a staging database that is in complete synchronization (schema wise) with the production database. In this case, you can run the tuning wizard against the staging database – and get meaningful recommendations that you can apply to the production database.
The wizard will take a while to analyze the file – the larger the file, the longer the analysis will take. The recommendations of the wizard will include creating indices, dropping indices and more.

I was interested in trying these trace templates but when I try to import the TDF files, Profiler says ‘wrong format’.
It might be slightly outdated. try the tips in these threads
https://ask.sqlservercentral.com/questions/45452/profiler-template-has-the-wrong-format.html
http://dba.stackexchange.com/questions/23399/how-can-i-change-the-target-server-type-for-a-trace-template