IIS, ASP.NET and WCF Performance counters during a stress test (load test)
Introduction
So, you are ready to run your load test (read this post first if you are new to load testing).
You have a handle on the ‘big picture’ metrics you want to capture – the requests per second – and the average response time. These are ‘cumulative’ metrics and give you an overall view of the system under test. How do you see what is happening minute by minute, second by second , request by request?
Windows performance counters can provide you with a detailed, play by play graph of various important benchmarks. Their only drawback is that there are too many of them – and it is often confusing to figure out which are the appropriate counters to monitor. For instance, in IIS itself there are at least six different queues – all similar sounding – that seem to be related to HTTP request queuing. Which one should you really monitor during your load test to see if IIS is getting swamped (too many ‘queued’ requests) ?
In this post, I will list the most important counters to look for while testing an asp.net web application running on IIS (integrated mode) – with WCF backend services. Also, certain SQL Server performance counters and wait statistics will be briefly discussed.
CPU Usage
- Processor Information\Processor Time
- For multi core systems, need a tool like OpenHardwareMonitor to determine load on each core.
.NET CLR (Memory and Threads)
- NET CLR Memory \ #bytes (in all Heaps)
- (OPTIONAL) NET CLR LocksAndThreads\ # of current logical Threads
- (OPTIONAL) NET CLR LocksAndThreads\ # of current physical Threads
IIS
- Http Service Request Queues\CurrentQueueSize (This is the App Pool Queue, requests are queued here first, IIS picks up requests from here)
- Application Pool Monitoring – APP_POOL_WAS (for the pool configured for your specific application)
ASP.NET (Requests – current, queued, rejected)
- ASP.NET v4.0.30319\Requests Queued
- (Optional) ASP.NET v4.0.30319\Requests Rejected
WCF
-
Under Web Services
Web Service\Current Connections – Maximum Connections.
-
Under ServiceModelService
Calls and Calls Outstanding.
NOTE: If you are using a tool like StresStimulus (see getting started with StresStimulus), the calls outstanding corresponds directly with the ‘requests pending’ counter in StresStimulus. These are just the requests yet to be processed.
By default, only ServiceModelService counters are maintained. If you want ALL counters (ServiceModelEndPoint and ServiceModelOperation), ensure the following is set in the web.config file (in your ‘Services’ layer)
<configuration>
<system.serviceModel>
<diagnostics performanceCounters="All" />
</system.serviceModel>
</configuration>
<configuration>
<system.serviceModel>
<diagnostics performanceCounters="All" />
</system.serviceModel>
</configuration>
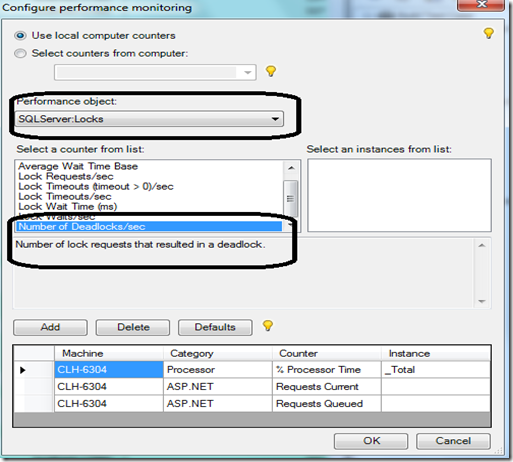
SQL Server (memory, deadlocks)
- CPU Usage
- Memory Page Faults / sec
- Locks—>Average Wait Time –> Greater than 5 secs
- Locks—>Deadlocks per second
SQL Server WAIT STATISTICS
Wait statistics can be captured using this query . The results will contain cumulative and average wait times as shown below:
The three big ones (marked in red) are explained below – for a full understanding of these stats, start here.
PAGELATCH_UP
One of the ‘wait statistics’ that shows up high on our database server was – PAGELATCH_UP wait time. This usually implies that the server is waiting for data pages to be read from disk to memory. This could imply ‘not enough’ memory or an incorrect ‘buffer pool’ setting making disk reads more frequent than they need to be.
Depending on current memory capacity, an upgrade of the memory on the database server may be recommended.
LATCH_EX
This is high due to waiting on some non-page related structure inside SQL Server. The good news is that is not related to disk IO or your data at all. The bad news is that it is harder to figure out what is using SQL Server – for e.g. – an external app like a 3rd party profiler or a data modeling tool. One can use the DMV (dynamic management view) sys.dm_os_latch_stats to get more info on this LATCH.
CXPACKET
This indicates parallelism, not necessarily that there’s a problem. The coordinator thread in a parallel query always accumulates these waits. If the parallel threads are not given equal amounts of work to do, or one thread blocks, the waiting threads will also accumulate CXPACKET waits, which will make them aggregate a lot faster – this is a problem.
Summary
Figuring out which performance counters to monitor at which layer (IIS, ASP.NET, WCF, SQL Server) can be confusing. There are often multiple candidates (e.g. there are multiple ‘request queues’ that IIS uses). This post consolidates some of the more relevant counters that provide information about a Microsoft Stack web app (IIS –> ASP.NET –> WCF –> SQL Server).


Leave a Reply