StresStimulus (and Fiddler) for Load Testing
Fiddler as a load testing tool
Using a fairly obscure feature (hold down the SHFT key while ‘replaying’ your request in Fiddler), you can send multiple requests to your URL – providing a quick way to stress test.
However, obtaining meaningful stress test metrics – such as average response time, average pages per second etc. is difficult. Also, configuring a realistic load test (step load, browser type, network type etc.), though possible, is much more complex in Fiddler. It requires a fair amount of tweaking and scripting – but it is all doable (as described here ).
StresStimulus is a (not free) Fiddler add-in which lets you easily perform complex load tests. It works right off fiddler sessions and can create tests based on sessions from Fiddler. This post summarizes the ‘learning curve’ I had with this tool.
Getting started with Load Testing
If you are new to load testing, you may want to read this introductory post on load testing terminology.
Configuring your first test (Simplest possible use case – 500 users accessing a single URL)
I wanted to start with something simple. Just a single URL – being accessed by 500 users – all at once (500 concurrent requests).
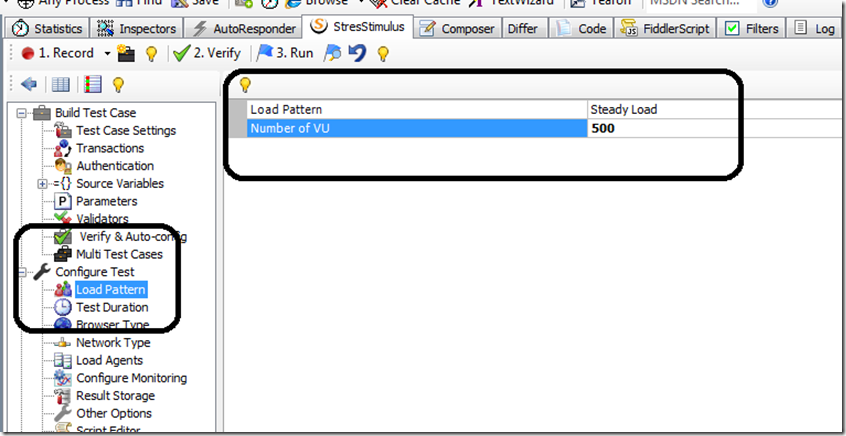
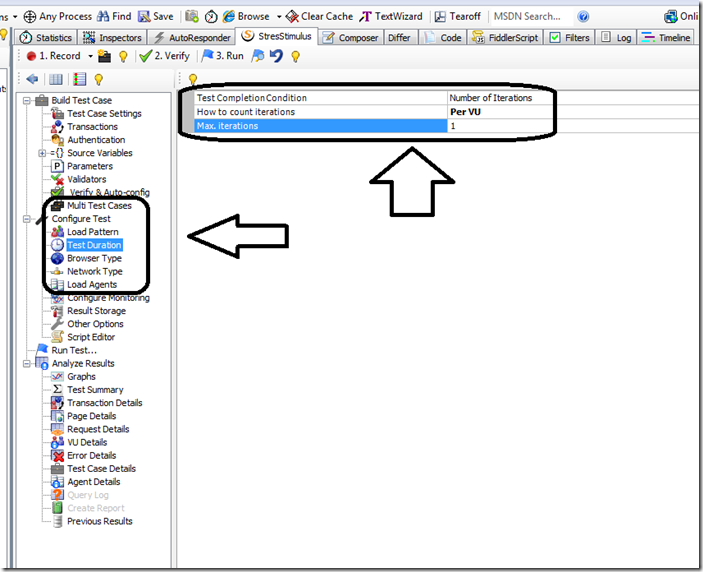
This took a bit of figuring out – the settings to tweak are shown below.
Step 1 – Under ‘Load Pattern’, select Steady Load (this is the same as Constant Load) – and Number of VUs (Virtual Users – each VU simulates one user).
Step 2 – How to count iterations is what you need to change to ‘Per VU’ and number of iterations equal to 1. This will simulate each user trying to request the one URL exactly once (one iteration). The default settings in StresStimulus do not work with this logic (they set the number of iterations to the number of VUs).
NOTE: Even though you ask the tool to send 500 requests all at once, in reality, this will not happen right away. Your client machine (the machine running fiddler’/stresstimulus) is not capable of generating that type of load. In fact, it will take a few seconds (took a whole minute on my laptop) to build up to that. If I had set it to 10 VUs for example, there would be no ramp up time – and it WOULD show a constant load of 10 requests right away (no building up to 10 users).
Configuring your second test (2 successive URLs – 500 users).
In this scenario, each user requests TWO URLs in succession. This could map to a use case of a user logging in (URL 1) and then accessing their online account (URL 2). The idea is to determine the throughput of common user scenarios – if each user goes through a ‘typical’ flow (e.g. Logging in and then accessing account info), it makes sense to load test the entire scenario (pretend as though 500 users were logging in and checking their accounts).
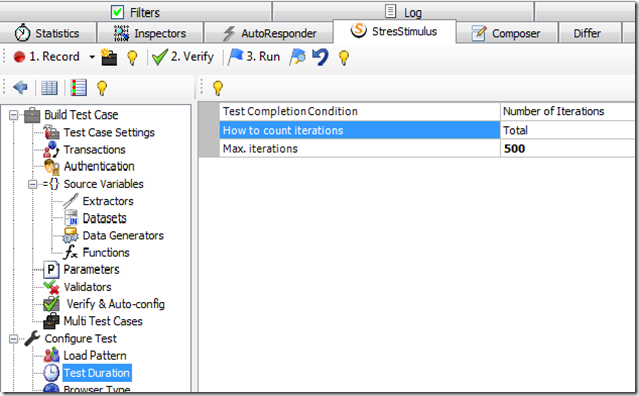
The only changes in StresStimulus are under the ‘Test Duration’ – where you would now set the ‘Test Completion Criteria’ as ‘Number of iterations’ instead of ‘Per VU’.
- How to count iterations – Total
- Test Completion Criteria – Number of Iterations
How to interpret your test results
How many concurrent users did my test simulate?
The ‘requests/sec’ tries to give you an answer to this. If your server is slow, the requests per second (requests processed per sec) will slow down – and your graph will reflect either a flattening or a drop. This CAN be thought as the number of concurrent users – if you are requesting a single resource in your test. Just because you are simulating 100 users per second DOES NOT MEAN that you are actually PROCESSING 100 users per second. The processing depends on the speed of your server – and this is reflected in the requests PER SECOND. So – if you had a SUPER fast server – that COULD handle 100 users per second, that tool would show requests per second as 100. In real life, your requests per second will be far lower than the Max VUs that you are load testing for.
Pages Per Second (not the same as requests/sec – each page could have multiple ‘http requests’)
Since this is one of the most important metrics that you are interested in (average response time being the other), I spent a lot of time (with StresStimulus support) trying to clarify this.
Pages per second can be thought of as three different metrics:
- pages requested per second,
- pages received per second
- pages processed per second
Each of these is equal to the number of pages (requested/received/processed) divided by the total test duration. So, if all pages are received by the end of the test, all three parameters will be exactly the same. StresStimulus only shows one of these three (since they are all equal) – under the generic name ‘Pages per second’.
If for any reason, all the responses are NOT received by the end of the test duration, these will be unequal.
Page Response Time (My Page response time is 30 seconds – and yet the tool shows 10 pages processed per second. How is that possible?)
There is no conflict here. The requests are processed in parallel – right from where the web server accepts them –> to passing it along to your web app –> to your data tier – everyone tries to process requests in parallel (typically using a pool of threads). So – you will have many pages per second being processed – even though each page may take 30 seconds (or more) to respond.
Total Test Duration
If this is high, that means your server is taking long to process requests. The tool automatically lowers the number of requests (per sec) if this is the case. So – you should see a low ‘pages per second’ and a high ‘Test Duration Time’ for an overloaded server (as seen in the table below – these are from a real test).
| Test run duration (s): | 91.71 |
| Avg. page/sec: | 4 |
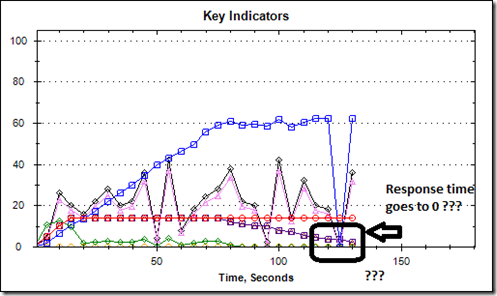
Graph shows ‘zero’ points – where response time goes to zero.
This means that it was not possible to determine average response time during this checkpoint because no response were received. It looks like, during this interval, the server was totally overloaded. No responses were returned, and therefore there is no response time to measure.
Performance Counters During Load Testing – Some Advanced Features
Q:How do I display the ASP.NET performance counters on the monitoring graph?
A: on the workflow tree under configure test, click “configure monitoring”, in the pop-up window, enter your Web server IP address. If a login box will appear, enter the server account credentials. Select an ASP.NET performance counter and click Add. Add all counters, you need. After that, click OK. Your server ASP.NET performance counters will be displayed on the graph when you run the next test. To get an understanding of the relevant counters in a Microsoft web app (IIS, ASP.NET, WCF, SQL Server), check out this post. A maxing out CPU (use this tool if you have a multi-core CPU).
Where exactly is the bottleneck ?
Of course, the load test measures total round trip time – and does not know what is going on inside each layer of your app. It will not tell you WHERE your bottleneck is – just whether or not you have a bottleneck. However, there are some informative tests that you can perform to try and isolate certain ‘common culprits’ .
DML statement (Updates , Inserts, Deletes) versus Retrievals
To get a complete picture of your system’s performance, it is important that you select a few INSERT, DELETE and UPDATE services to test as part of your load test. These DML statements have different characteristics than simple retrievals (READS). Often times, you will find INSERTS heavier (more time consuming) than READS. Although, I have seen systems where complex READS outweigh any INSERTS and DELETES. A Read in most cases consists of one or more JOINS – which can be simple or complex. Depending on the complexity of the joins, you may have a monster query on your hands (getting all order details of all orders for all customers).
Summary
StressStimulus provides a fairly cost effective way to produce a consistent ‘load test’ baseline. It contains most of the features of an enterprise load testing tool like LoadRunner. One can create tests that simply access a URL or mutiple URLs. One can also ‘record’ a web session – in the same manner as Visual Studio’s Web Test Recorder. This post describes how to get started with a simple load test in StresStimulus – and more importantly, how to interpret the results of the test.


Leave a Reply